ProPanel is a reporting add-on for LearnDash that you can buy separately. Once activated, it provides additional insights into your courses, such as revenue, user activity, quizzes, assignments, and more. It also includes a customizable front-end dashboard for easy access to your reports.
NOTE: ProPanel versions 2.2.0 and earlier are now fully integrated into LearnDash core. Curious to learn more? Check out the announcement for all the exciting details about the ProPanel update.
Installation #
You can download the ProPanel plugin from your LearnDash account. You can log in to your account, download ProPanel, and follow the installation instructions below.
Installing ProPanel #
To Install ProPanel:
- Go to Plugins > Add New
- Click Upload Plugin
- Browse for and select the file that you downloaded after purchase. It will be in a .zip format.
- Click Install Now
- Click Activate Plugin
How to Set Up ProPanel #
Automatic Creation: #
By default, the following reporting pages get created on plugin activation:
- ProPanel Dashboard
- Student Quiz Results
You can search for the above pages in Dashboard > Pages admin menu.
Manual Creation: #
ProPanel Dashboard: Follow the below steps to manually create the ProPanel Dashboard.
- Go to the Pages menu and click Add New button.
- On this new page, add a Page title.
- After that, click the + icon at the top-left of the Gutenberg editor.
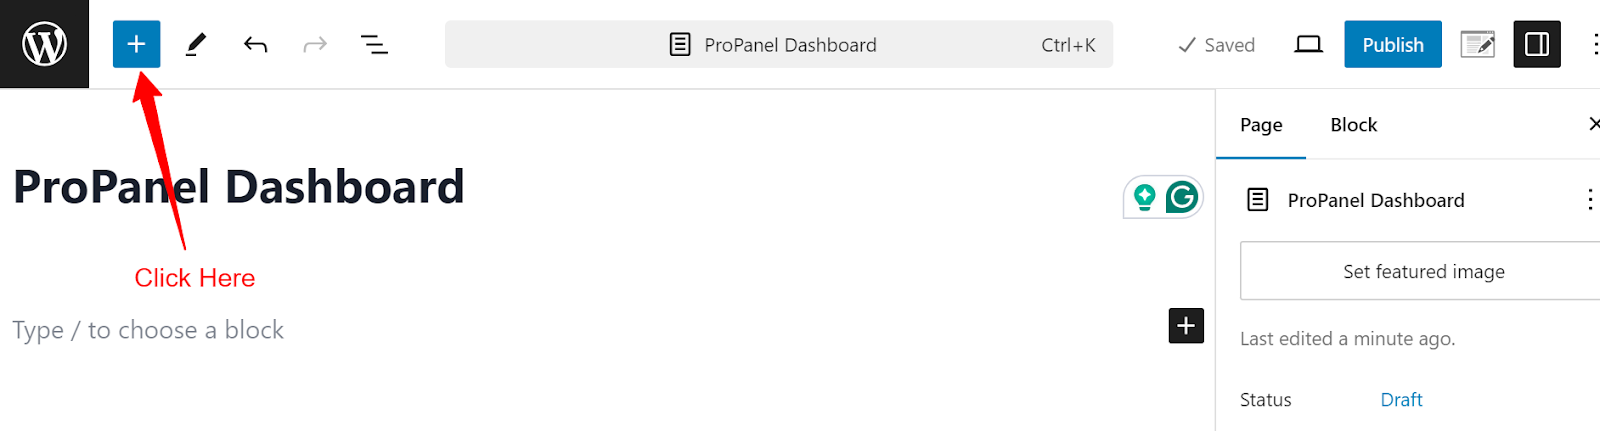
- In the new menu that available, click on the Patterns tab.
- Search for ProPanel Dashboard under the Patterns tab.
- ProPanel Dashboard will appear below the search bar.
- Clicking the ProPanel Dashboard pattern will insert it on the page.
- Now click the Publish button at the top-right of the Gutenberg editor.
- (Optional) It is recommended that you set the Page template to full width if your theme supports this option. Also, it is recommended that you set the Body Background color using theme settings to hex code
#f7f7f7.
Student Quiz Results: #
You can follow the above steps to also create Student Quiz Results page. However, in step 5 to 8, you need to search for and add Student Quiz Reports instead of “ProPanel Dashboard.”
Header Menu Settings #
When the ProPanel plugin is installed, the ProPanel Dashboard and Student Quiz Reports pages, which consist of different Gutenberg blocks, are automatically created. The admins can access these pages by visiting the menu ProPanel > Dashboard.
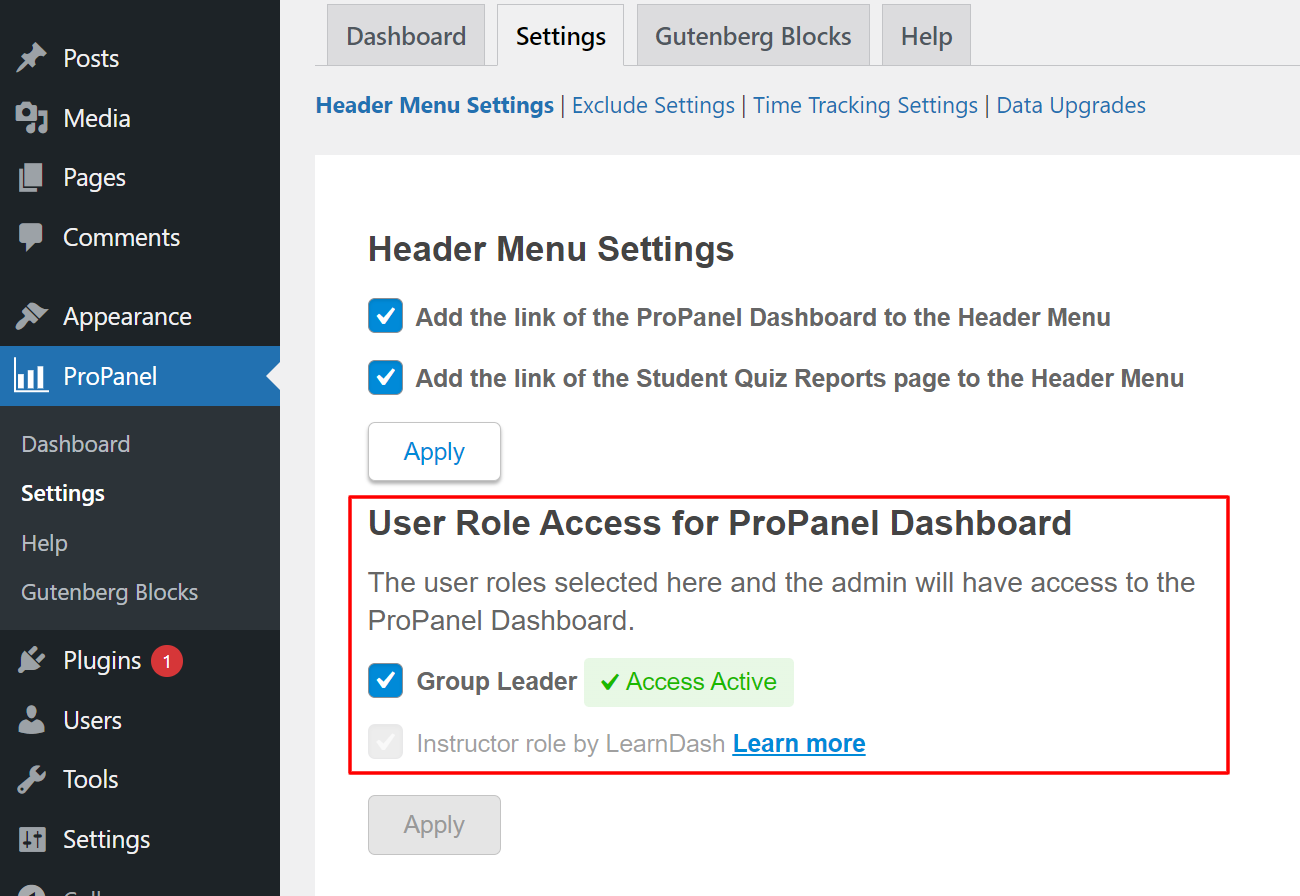
If the admin wants to include the links to these pages in the site’s primary menu, the Add the link of the ProPanel Dashboard to the Header Menu and Add the link of the Student Quiz Reports page to the Header Menu settings can be used. Enabling these settings will add the ProPanel Dashboard and Student Quiz Reports menus to the primary menu.
 Header Menu Settings
User Role Access for ProPanel Dashboard #
This setting section will list all the user roles supported by the ProPanel plugin.
Access to the ProPanel Dashboard for these roles can be managed from here. Currently, we support the user roles Group Leader and Instructor (from the extension Instructor Role), and access to the ProPanel Dashboard by these roles can be managed using this setting.
 User Role Access for ProPanel Dashboard
Exclude Settings #
Exclude Settings can be used to exclude specific courses, specific user roles, and specific users from all ProPanel Reports and Graphs.

Time Tracking Settings #
These settings enable you to track the actual time spent by learners by discarding the time
- when the learner opens another tab and leaves the current tab or
- the learner is Idle on the current tab, such as the learner does not move the cursor, or
- the learner is Idle on the current tab such as the learner does not perform any keyboard strokes.
These settings can be found by navigating to the Reports > Settings tab.
Configure Idle time #
This Setting enables you to track the Idle Time of the learners on the site. Enabling this will start tracking the idle time of the users based on mouse movements and keyboard strokes.
Note: We do not recommend you to switch off this setting as it will stop tracking the Idle Time and affect the Time Spent Reports on the Reports Dashboard, which might lead to inaccurate data.
Idle Time (in seconds) #
Configuring the Idle Time will open a popup every time a learner is idle for the same amount of time as configured here.
Idle Message #
This is the message that learners will see in the popup if they are idle.
Active Button Label #
Clicking on this button will resume the time being tracked on a course for the learner.
Idle Time Configuration Log #
This section shows your activity history, where you can check the last time you enabled/disabled this setting.
 Time Tracking Settings
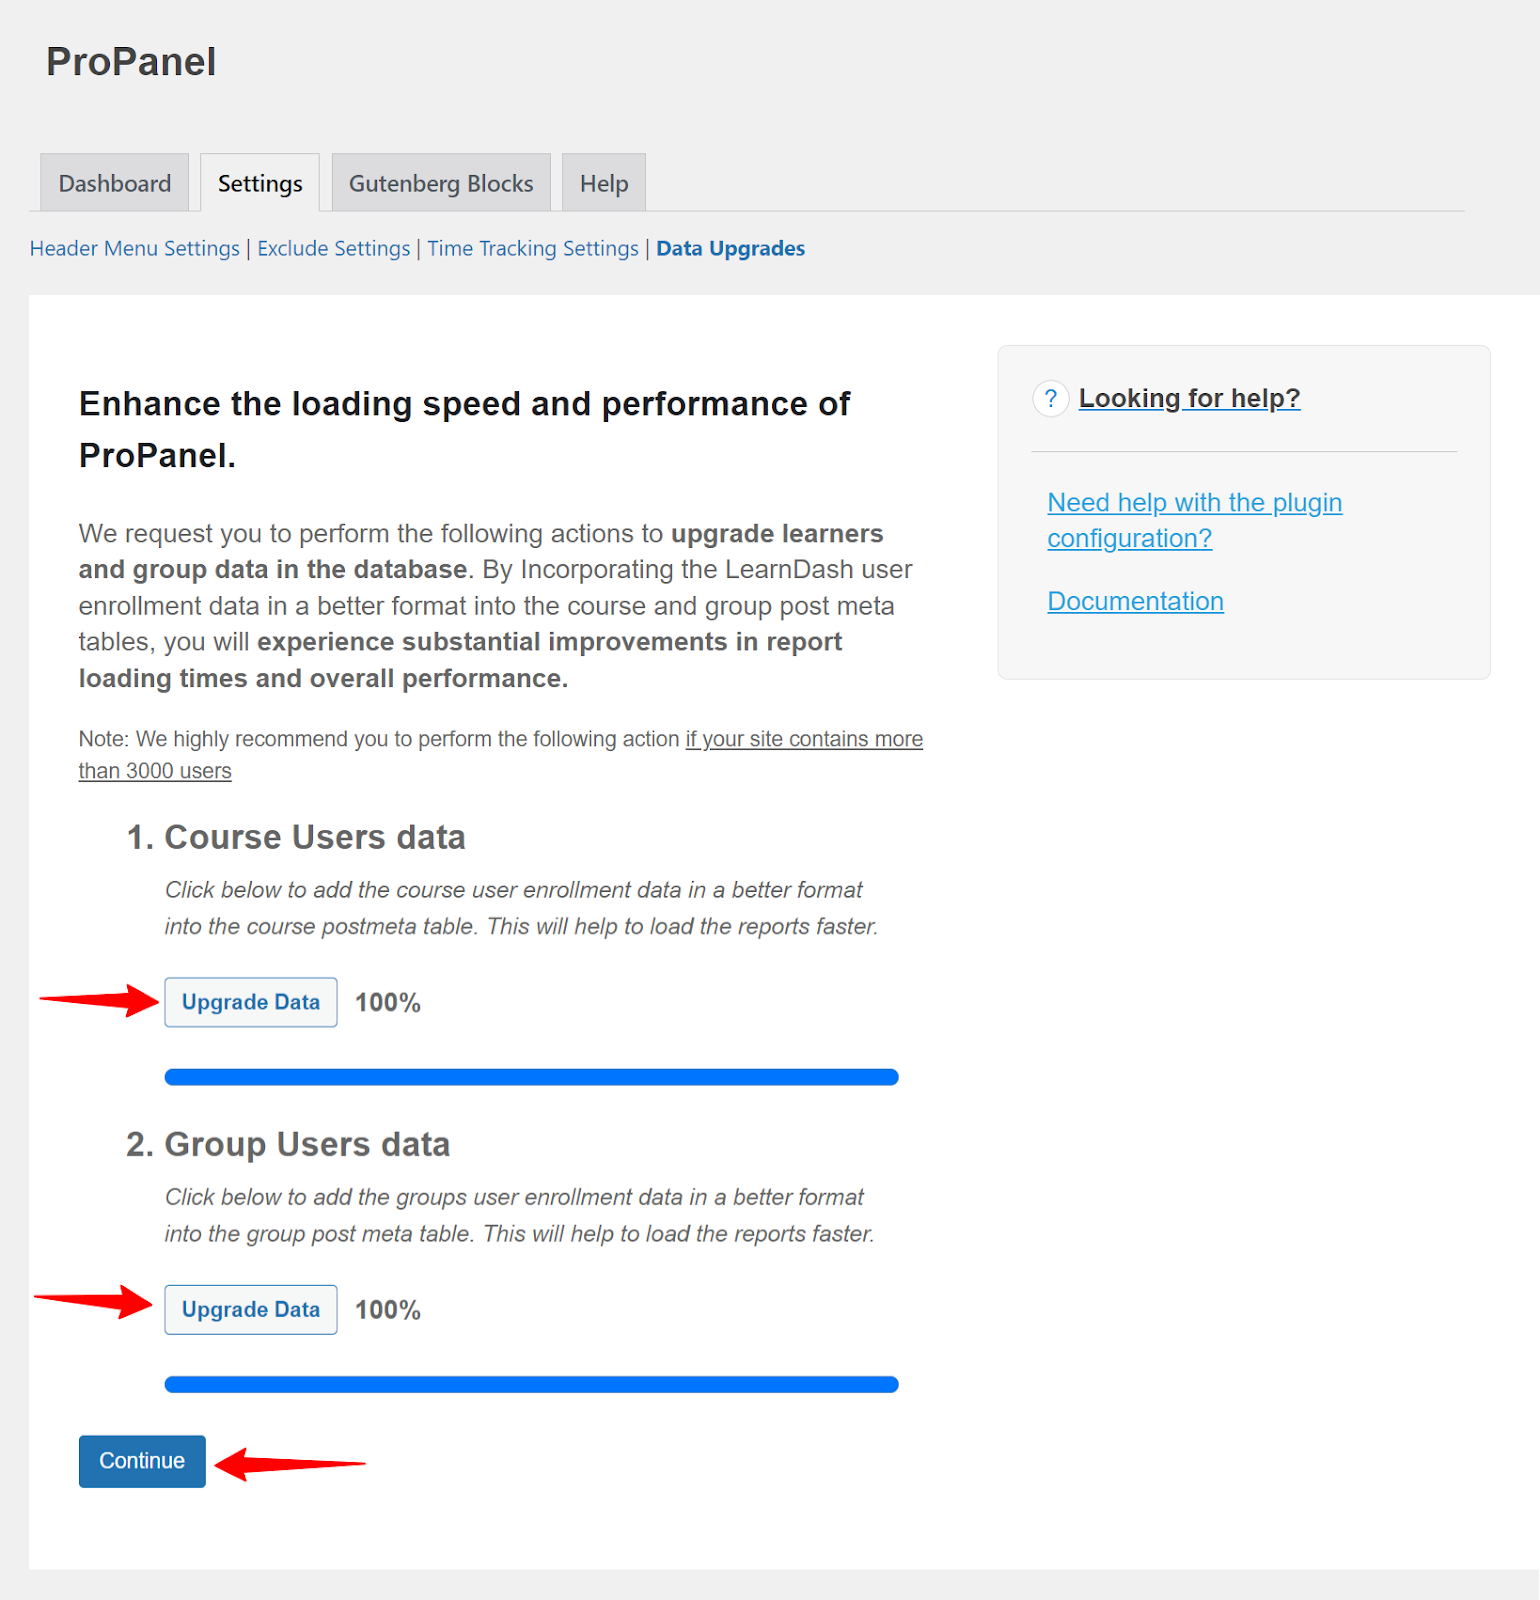
Data Upgrades #
Data upgrades can be run to enhance ProPanel’s loading speed and performance.
Following data upgrades can be run:
- Course Users Data
- Group Users Data
To run either data upgrade, click the Upgrade Data button below that data upgrade and then click the Continue button after the status is 100%.
 Data Upgrades
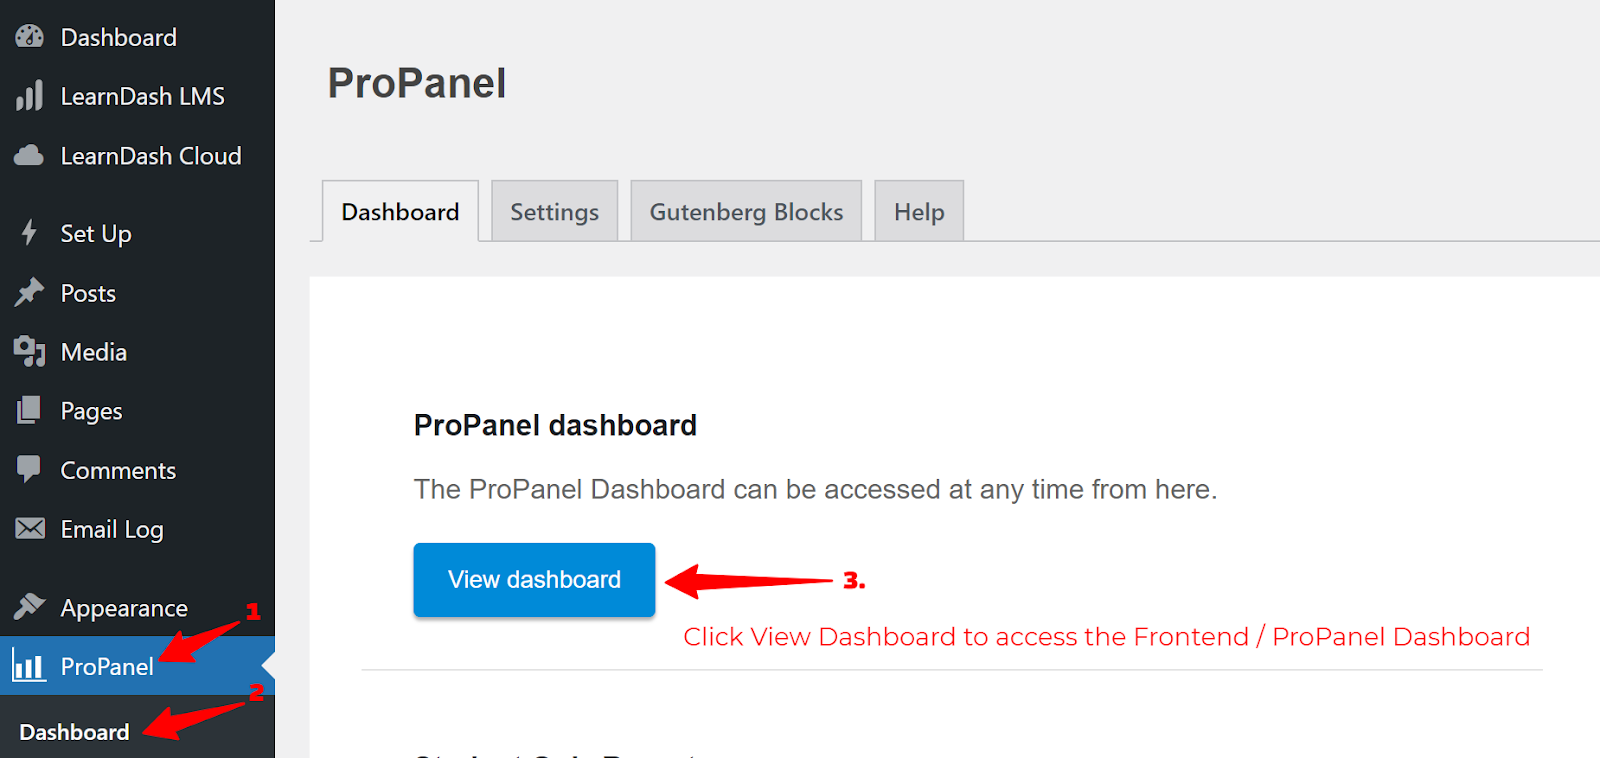
The Frontend Dashboard #
The Frontend Dashboard, also known as the ProPanel Dashboard, is a pre-configured Reports Dashboard that is auto-created on your site as soon as ProPanel is installed and activated.
It can be accessed at any time from the ProPanel > Dashboard Tab of your WordPress admin area.
It includes all the ProPanel Reporting Blocks for viewing various reports, such as Revenue from Courses, Daily Reports, Time Spent, Course Progress Rate, Quiz Completion Rate, Course Completion Rate, Time Spent on Courses, and Detailed Course Reports, etc.
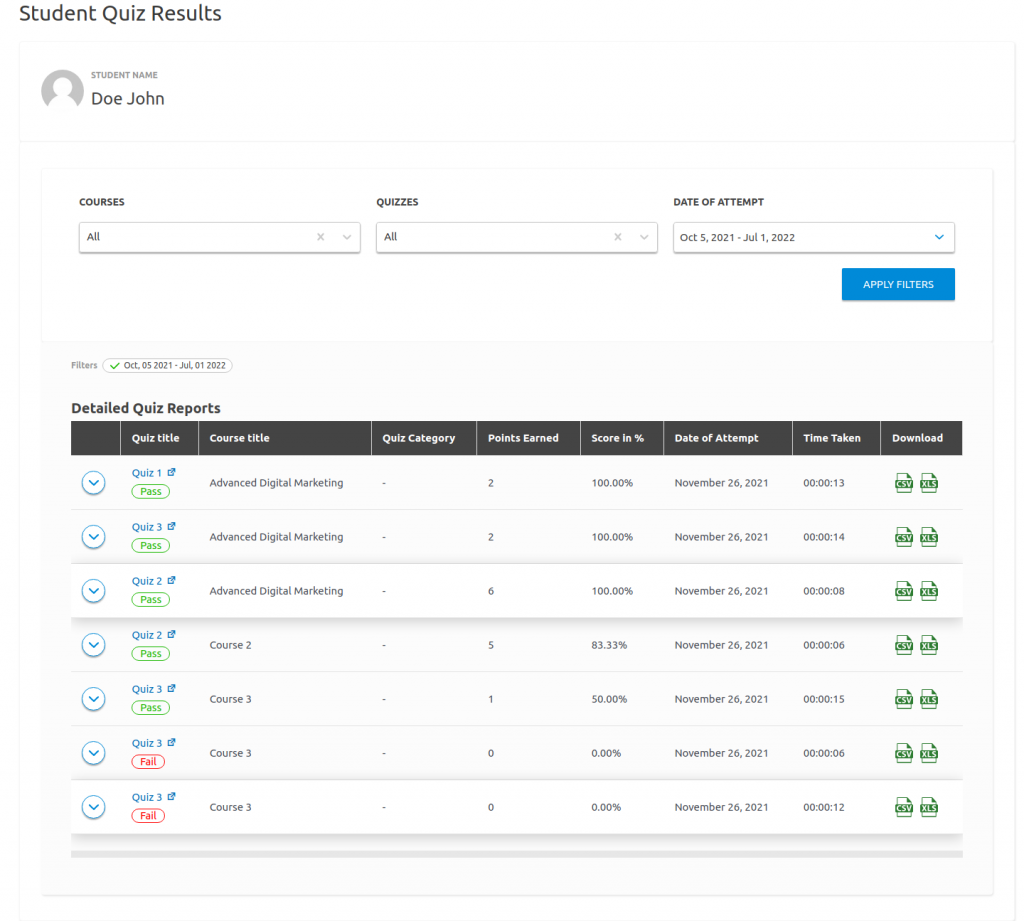
Student Quiz Reports #
The Student Quiz Results feature allows any user to view all the details of his/her past quiz attempts.
Student Quiz Results
As you can see in the above screenshot, the user can filter the results by Courses, Quizzes, and Date of Attempt.
They can also download any specific attempt details by clicking on the CSV/XLS buttons, as shown in the screenshot.
Clicking on the quiz title will open a page that shows the details of that particular attempt, such as the users answers, correct answers, points earned, class average, etc.

Quiz Attempt details
Similarly, clicking on the accordion icon in the table will display a list of questions that will be marked red if incorrect and green if correct.

Attempt details accordion open
Clicking on a specific question number will show details of that particular question.

Question Attempt details modal
All ProPanel Reporting Blocks #
ProPanel has multiple report blocks to represent the graphs and tables. The plugin uses the default block pattern to build the default report view, which can be directly used from Add Block > Patterns > LearnDash Dashboard. Refer to How to Set up ProPanel for more details.
If you’re a fan of reports, don’t miss the Reporting documentation where you can explore the powerful reporting options for your courses, learner activity and beyond.
Duration Selectors Block #
This Gutenberg block is a header block for the ProPanel plugin, this block has the date/duration selector & placed at the top in the default pattern but can be added anywhere on the page as per the requirement. The report created without this block will show the reports for a fixed Past 30 days duration.

Duration Selector Block
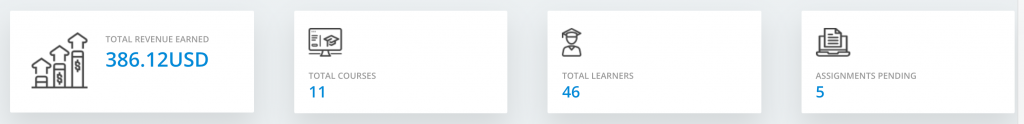
Counter Blocks #
ProPanel has four quick counter blocks. These blocks can be used to show quick counts on your reports page. The default report pattern adds them in the first row. (Refer to the image below)
Counter Blocks
- Total Revenue Displays the Total Revenue Earned via Courses for the selected date range. (with an increment/decrement metric as compared to the previous time period).
- Total Courses Displays the Total Courses that were published/created during the selected date range. (with an increment/decrement metric as compared to the previous time period)
- Total Learners Displays the total number of subscribers that were added to the site for the selected date range. (with an increment/decrement metric as compared to the previous time period)
- Pending Assignments Displays the total number of ungraded (or yet to grade) assignments on the site.
Revenue From Courses #
This Gutenberg block summarizes the earrings for the selected timeframe and shows the line graph with earnings per course, along with the second line on the graph showing earnings in the past, if available.

Revenue earned per course
- The graph for the Revenue earned Course-wise for the selected date range.
- The insight Average Revenue per course is the total revenue generated by each individual course divided by the total number of courses. (with an increment/decrement metric as compared to the previous time period)
- For example, the total Revenue generated by all the courses is $1000, and there are 5 total courses, so the average is $200.
- Benefits: Check for top revenue-generating courses, such as AOV.
Daily Enrollments Block #
- This Gutenberg block lists the user enrollments in the courses with respect to the dates. It lists the total number of enrollments in the selected timeframe along with the daily enrollment line chart.

Daily Learner Enrollment Chart
- The graph for the total number of daily learner enrollments for the selected date range.
- The Insight Average Daily Enrolments is the Total enrollments in all courses divided by the number of days in the selected date range.
- For example, the total enrollments between 10th-14th November are 20, so the average is 4.
- Benefits: Check enrollment trends for different time frames.
- You can export this graph as SVG or PNG, and you can export the graph data as a CSV file from the top-right menus.
Report Tools Block #
The Report Tools Block allows you to create custom filters for your reports, helping you focus on the information that matters most.
Course Report Filters #
These filters include Categories, Courses, Lessons, Topics, or Learners(users). After selecting and applying these filters, all the course report blocks will be filtered. For group leaders, groups will be available as the filter instead of the course categories.

Course Filters
Quiz Report Filters #
Quiz Report Filters help you create custom reports to learn more about student interaction with quiz work.
Default Quiz Reports #
- List of all the quiz attempts by students in the tabular form, all these individual reports can be exported as a CSV file or Excel file.
- The filter with the option to filter the results based on the user or quiz is provided. Search for the user/quiz in the filter and click apply to filter out the default quiz reports.

Quiz Report Filters
Custom Quiz Reports #
- Lists all the quiz attempts, groups them course-wise & lists along with the questions & results.
- Filters like Course, Group & Quiz are available for these reports.

Custom Quiz Reports
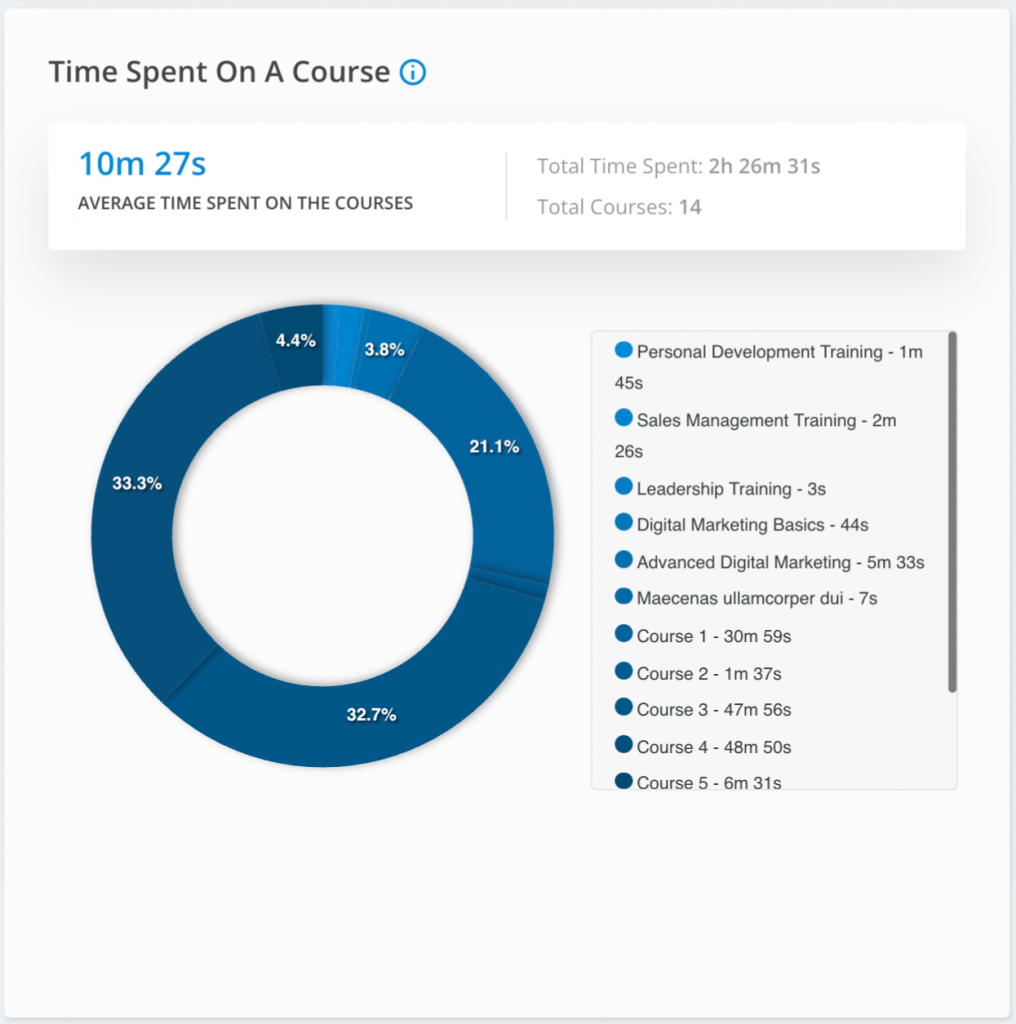
Time Spent on a Course Block #
This Gutenberg block shows a summary of time spent on each of the courses. The data will be represented in the form of a pie chart for course-wise time spent when a single course is selected from the filters. The same block shows a bar chart listing the time spent by each learner on the selected course.
 Time Spent on a Course Block
- The graph for the time spent by the learners on each Course.
- The Insight Average Time spent per Course is the total time spent by all users on all courses divided by the total number of courses.
- For example, the total time spent on all courses by all users is 120 minutes, and there are 5 courses, and the average is 24 minutes.
- Benefits: It can be used to check if students are actually taking courses and to determine the minimum time students spend on courses before completing them.
Course Completion Rate Block #
Using the Course Completion Rate block, users can visualize the percentage of learners who have completed a course. Group leaders can see the course completion rate data for their own group(s) using the local group filter. Admins have the flexibility to filter by categories.
Clicking on the show all courses will show the data for all the courses in a modal.
You can export this data as a CSV file from the top-right menu.

Course Completion Rate

Course Completion Rate modal
Course Progress Rate Block #
The Course Progress Block will allow admins/group leaders/instructors to know how much progress has been made by all learners in a course(s). Switch to the local course specific tab to access the report. Applying local group and course filters will show how many and which learners are falling behind in a particular course.
Clicking on any particular course in the graph will show details of each individual users progress for that course.
Course Progress rate Individual Courses Course Progress modal for a Course
- Alternatively, by switching to the learner tab, The Course Progress Block can allow group leaders/instructors to also understand the progress of enrolled courses for a particular learner. To do this switch to the local learner tab and apply a learner search filter to access the learner specific course progress report.
- Here, clicking on the learner will show details of his progress in all the courses to which he has enrolled.

Course Progress Individual Learners

Course Progress modal for a Learner
Quiz Completion Rate Block #
This Gutenberg block shows a bar chart listing all the courses with respect to their % completion rate, when an individual course is selected, it shows the pie chart indicating the completion statuses of the quizzes (Completed/Incomplete)
 Quiz Completion Rate Block
- The graph shows the percentage of learners who have completed all quizzes in each course.
- The insight Average percentage of Quiz Completion is the average of the percentage of learners who have completed all the quizzes in each course.
- For example In 3 courses, 5%, 10%, and 15% of the students completed all quizzes, the avg is 10%.
- Benefits: To check which course is easy for students to complete and which course is difficult based on the number of students who have completed all quizzes for a course.
Quiz Completion Time Block #
This block displays the average time spent on the quizzes & lists the bar chart showing time spent on the quizzes of each of the courses by their learners. When a particular course filter is applied, the bar chart shows the time each user takes to complete the course quizzes.
 Quiz Completion Time Block
- The graph shows the total time spent by the learners on quizzes (to complete the quiz) in each course.
- The insight Average Quiz Completion Time per Course is the average of the aggregate time it took the students to complete quizzes in each individual course divided by the total number of courses.
- For example The aggregate time it took for users to complete the quizzes in each course for 3 courses is 10, 20, and 30 mins respectively, and the avg is 20 mins.
- Benefits: Check which quizzes are tough and, hence, take more time to complete.
Learner Pass/Fail Rate Block #
This Gutenberg block shows the pie chart containing the ratio of the pass/fail percentage for the selected course, when not selected, the bar chart containing the percentage of pass students for the course will be displayed.
Learner Pass/Fail Rate Block Block
- The graph shows the pass rate for the quizzes in each course. (how many students passed all the quizzes in each course)
- The insight Average Pass Rate which is the average pass rate of all the courses.
- Benefits: To understand trends for pass rates for students in each course and make changes to quizzes accordingly.
Average Quiz Attempts #
This block shows the average attempts made on the quizzes by learners, shows the count of total attempts made on the quizzes and shows the bar chart of quizzes with the number of attempts made by the learners.
The course selection is required to see this report since the report shows the quiz-wise user attempts for the courses.

Inactive Users block #
This block will show the administrators/instructors/group leaders which users were inactive during a specific time frame and when they were last active.
You can also filter the results by Duration, Groups, and Courses.

Inactive Users block
Learner Activity Log #
This block will show the administrators/instructors/group leaders all the latest activities related to Courses and Course Progression.
These activities include completing courses, lessons, and topics, attempting quizzes, and visiting any course, lesson, or topic for the first time.
You can filter the options by either selecting the users from the learner search bar or clicking on the down arrow icon next to each user name. This will essentially select the corresponding user and show his/her latest activity. This block can also be filtered by using the Duration filter.

Learner Activity Log
Please refer to the screenshot below to see how the activity of a specific learner is shown when selecting the learner.
Course List Block (Aka Detailed Course Reports Block) #
This block displays the course data in tabular form. When the particular course is selected, the same block shows the list of users who are enrolled in the course. On the selection of the user/learner, the table displays the list of courses in which the selected learner is enrolled.
The block also allows the export of table data in the form of CSV or Excel files.
 Course List Block (Aka Detailed Course Reports Block)
Please note that the Course List block functions correctly when the Course Reports filter is applied. When using the Date Range filter alone, the data displayed may not be accurate.
For precise results, it is recommended to use the Course Reports filter alongside the Date Range filter. Refer to the screenshot below for the Course Reports filter interface.
Additionally, the Course List block uses different date types, such as enrollment dates, quiz attempt dates, and completion dates. Therefore, the table columns may vary based on the filter used.
Quiz Reports Block #
This entire block is only used for Quiz reports & will become visible when the Quiz Reports tab is selected from the Report Tools block.
According to the selections (Default Quiz Report View / Customized Quiz Report View), the quiz data will be displayed in the tabular format.
Default Quiz Reports
Custom Quiz Reports
Student Table Block #
Students can view their past quiz attempts and responses and analyze from the detailed quiz results using the Student Table block and the Reports Tools block.
 Student Table Block
Student Profile Block #
This block is used in conjunction with the Student Table block. This blocks lists the Student Name and Avatar.
 Student Profile Block
NOTE: Regarding ProPanel changes, this document is related to: https://www.learndash.com/support/docs/core/reporting/#front-end-display-of-propanel
One of the ways you can display LearnDash Reports on the front end of your website is through blocks. Currently, the following six blocks are available for your use:
- LearnDash Report Filters
- LearnDash Reports Overview
- LearnDash Progress Chart
- LearnDash Activity Report
- LearnDash Reporting
- LearnDash Full Report Link
Note: These blocks when displayed on the front end will only be viewable by administrators and group leaders.
To add Gutenberg blocks to your pages or posts, follow these steps:
- Open the Block Editor
In the WordPress block editor (Gutenberg), navigate to your page or post and click the + icon to add a new block. - Search for Blocks
Use the search bar to find the desired block. For LearnDash, search for “LearnDash Report” or other relevant blocks. - Insert the Block
Click on the block you wish to insert into your page or post. - Customize the Block Settings
After adding the block, explore the settings panel on the right-hand side to adjust options and customize the block’s appearance and functionality according to your needs.
NOTE: Ensure that your LearnDash plugin is updated to the latest version to access all available blocks and features.
ProPanel Blocks #
One of the ways you can display LearnDash Reports on the front end of your website is through blocks. Currently, the following six blocks are available for your use:
- LearnDash Report Filters
- LearnDash Reports Overview
- LearnDash Progress Chart
- LearnDash Activity Report
- LearnDash Reporting
- LearnDash Full Report Link
Note: These blocks when displayed on the front end will only be viewable by administrators and group leaders.
To add Gutenberg blocks to your pages or posts, follow these steps:
- Open the Block Editor
In the WordPress block editor (Gutenberg), navigate to your page or post and click the + icon to add a new block. - Search for Blocks
Use the search bar to find the desired block. For LearnDash, search for “LearnDash Report” or other relevant blocks. - Insert the Block
Click on the block you wish to insert into your page or post. - Customize the Block Settings
After adding the block, explore the settings panel on the right-hand side to adjust options and customize the block’s appearance and functionality according to your needs.
Note: Ensure that your LearnDash plugin is updated to the latest version to access all available blocks and features.
In the following, we will explore the blocks.
LearnDash Reports Overview Block #
This block displays the four overview widgets from LearnDash reports; Total Students, Courses, Assignments Pending, Essays Pending.
LearnDash Report Filters #
This block displays the filter tools for LearnDash Reports.
You can filter by groups, courses, users, status, start and end date. With the “Per Page” option, You can control the output lists.
In the Email tab, you can communicate with the users selected in the Filters section.
This block requires one or more of the following other blocks to be placed on the same page to display the output of the filters through them:
- LearnDash Reporting
- LearnDash Activity Report
- LearnDash Progress Chart
LearnDash Progress Chart Block #
This block displays user progress; not started, in progress, and categories of percent complete.
Upon adding this block to your page, the settings can be observed in the right column. Options similar to those found in the Filter Block are available, allowing for customization of the output chart.
Moreover, with the “Display Chart” option, You can determine whether the chart is displayed as stacked or side by Side.
LearnDash Activity Report Block #
This block displays the LearnDash Reports course and quiz activity of your users.
Upon adding this block to your page, the settings can be observed in the right column. Options similar to those found in the Filter Block are available, allowing for customization of the output.
LearnDash Reporting Block #
This block displays the LearnDash Reporting information for User and Progress.
By default, utilizing this block, you have access to view all users and their course progress. A search box is provided for locating specific users. Furthermore, upon adding this block to your page, the settings can be observed in the right column. Options similar to those found in the Filter Block are available, allowing for customization of the output.
You will also see a download button at the bottom of this block that allows you to export all of this information in a CSV file.
LearnDash Full Report Link #
Use this block to place a link on the page for the full LearnDash Report.
When you add this block to the page, by default, it will display the sentence “Show LearnDash Reports Full Page”. By clicking on it, you will be redirected to a page where you can see all the LearnDash Report blocks along with reports.
To change the link’s text, click on it in the editor and change it to your preference.
Additional Resources #
This section contains information on improving performance and customizing dashboards and reports to best suit your needs.
Reports Performance and Server Specification Recommendation #
The performance of the Reports dashboard depends on the users on the site, server specification mainly the RAM and the memory limit the max proportion of memory from the RAM that can be used for execution of scripts, and the particular reports being generated.
In the latest ProPanel update, we have a done lot of optimizations along with introducing caching to improve the load time of our reports. Based our Performance testing we recommend you to have the following servers specification depending on the users on the site.
Please note that generating reports for larger datasets may take a while for the first time. We suggest being patient while waiting for the dashboard to load for the first time. In case any Report displays an error, kindly reload the page. On the second load, you will experience improved performance as much of the data gets cached. We have also shared below the time we expect to be required for all the reports in the dashboard to load.
The following table tells you the minimum specification that you can use depending on the users on your site.
Server Specification Recommendation #
| Users | CPU cores | RAM | Memory Limit | Load Time |
|---|---|---|---|---|
| 1500 | 1 | 1G | 256M | 1st Load 6m 48s 2nd Load 19s |
| 3000 | 1 | 1G | 512M | 1st Load 3m 29s 2nd Load 29s |
| 3000 | 1 | 2G | 1G | 1st Load 2m 50s 2nd Load 13s |
| 5000 | 1 | 2G | 1G | 1st Load 2m 22s 2nd Load 26s |
| 7000 | 2 | 4G | 1G | 1st Load 2m 51s 2nd Load 8s |
As mentioned in the table above, it is recommended that for websites with over 3,000 users, a 2GB RAM hosting plan is advisable. For websites with over 7,000 users, a hosting plan of at least 4GB RAM is recommended.
Caching to optimize the Reports loading speed #
We have introduced a caching module for the blocks with high load times. Now, you can easily check the time when the data was generated, and by clicking on the reload icon, you will fetch the most up-to-date data for the Report. Please refer to the following screenshot to observe this feature.